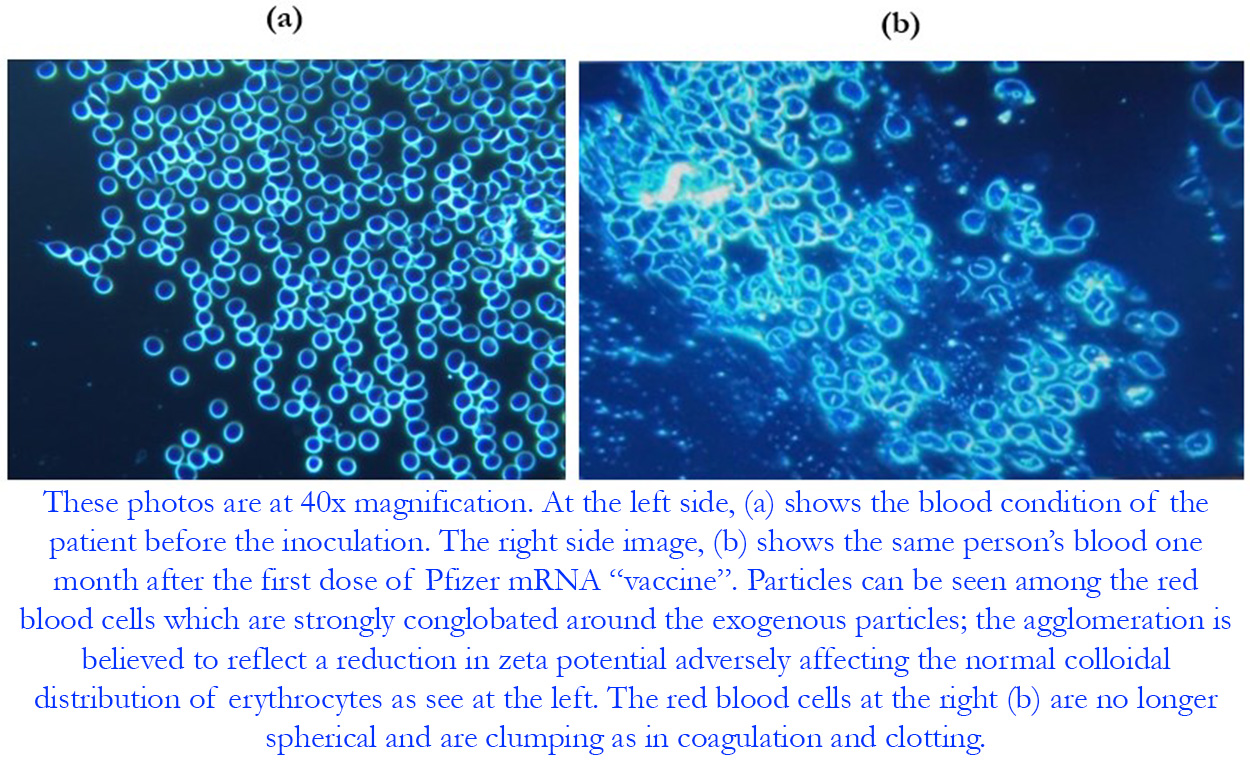
Image from the paper “Dark-Field Microscopic Analysis on the Blood of 1,006 Symptomatic Persons After Anti-COVID mRNA Injections from Pfizer/BioNtech or Moderna” by Benzi Cipelli, R., Giovannini, F., & Pisano, G. (2022). International Journal of Vaccine Theory, Practice, and Research, 2(2), 385–444. https://doi.org/10.56098/ijvtpr.v2i2.47
For hundreds of years, people have noticed that many diseases are often accompanied by a thickening and congealing of the blood. After microscopes became available, researchers saw that this sludging of the blood on a macro level was caused by the blood cells sticking together on a micro level. Then, starting in the 1930s, new optical devices allowed researchers see these states of health or disease in living tissue.
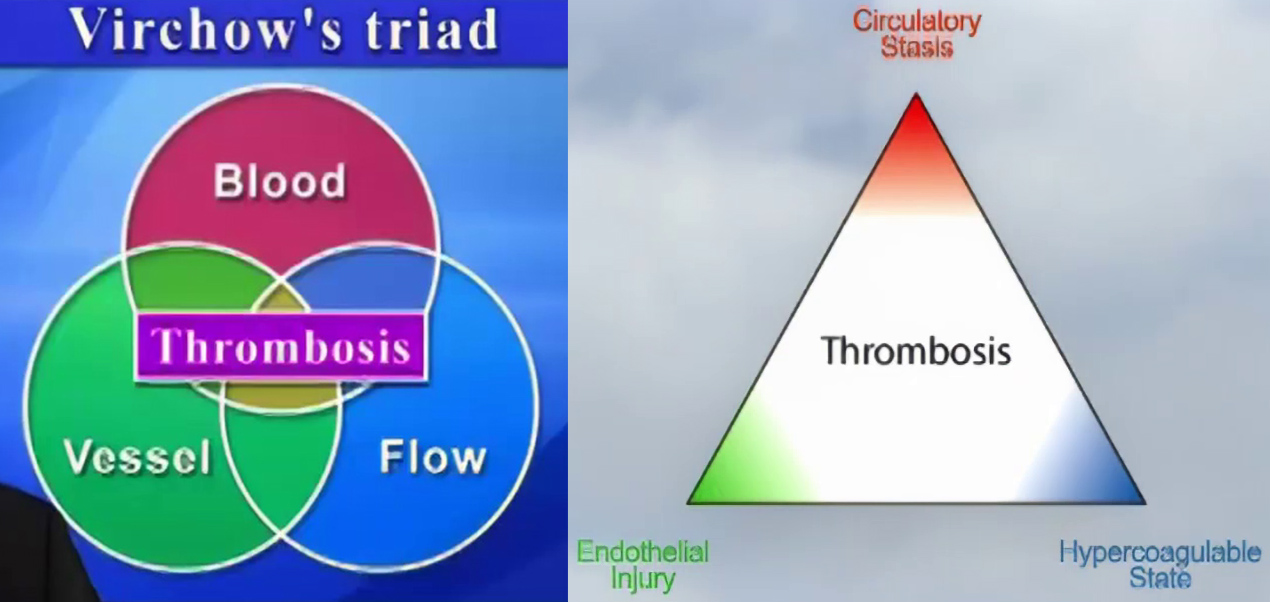
According to German physician Rudolf Virchow (1821-1902), coagulations/clots are caused by three factors – the more factors happening concurrently, the greater the risk: (1) Stagnant blood, (2) upset blood composition/chemistry (e.g., anti-clotting factors), and (3) vessel wall injury. I say: This is a good model to start the conversation, but electrostatics is the real workhorse powering the biology of blood flow. Electrical charge affects all three factors.
Melvin Knisely, PhD
Melvin Knisely, PhD, (1904–1975) studied sludging of the blood up until the 1960s and found it to be so common, whether symptomatic or not, that he thought the body must have ways to deal with it. Example that proved him right: Arterioles in the lungs have traps that catch small emboli (mobile masses), but when the traps are full, larger clumps can become life-threatening pulmonary embolisms. This has become a common occurrence since the rollout of COVID-19 vaccines. Since 2021, blood clots in general, and pulmonary embolisms in particular, are leading causes of injury and death in all age groups.
To learn about sludging of the blood, Knisely studied malaria in monkeys. He found that the parasites that cause malaria progressively thicken the blood. In severe cases, the bottom third of the inferior vena cava (large vein from the lower body to the heart) was filled with a solid sludge of blood cells infested with malaria; the middle third had small clumps of slow-moving cells; and the upper third had free-flowing plasma with hardly any blood cells.
In an attempt to amend the situation, he saw immune cells called phagocytes engulf and destroy infected sludges, as one method by which the body breaks down aggregates. In one instance, he estimated that a monkey’s phagocytes ingested ¼ to ⅓ of all the red blood cells it had in circulation in three hours!
The presence of infected sludges – especially when shielded from immune cells by biofilm – may explain why infections such as Lyme can reactivate following remission. This means practitioners must to be careful when treating long-term infections, because therapeutic agents can break apart agglomerates that harbor pathogens and toxins, which then make the patient worse, before they get better. Just as revealing, when Knisely gave heparin to the monkeys (a common anticoagulant used in hospitals), it dissolved the clumping and allowed the monkeys to live much longer, without treating the underlying infection.
Conclusion: Knisely’s experience is key evidence to support Dr. Moulden’s contention that sludgy blood can cause brain damage. Knisely: “Those patients who survive an attack of real cerebral malaria always carry residual diffuse brain disease in the form of healed microscopic infarctions (blockages from microclots). This condition may be clinically so slight as to be unmeasurable, or there may be evidence of diffuse cerebral involvement with general dulling of the intellect.” Sound familiar?
Through his research and development, Knisely discovered that he could see small clots in the sclera (whites) of monkeys’ eyes, non-invasively, through examination, which were then confirmed by surgical incision. Knowing how useful this could be for diagnosing basic disease processes, Knisely developed a microscope to examine blood sludging in the vessels of the eye. He called his invention the “sclerascope.” Examining countless individuals with the sclerascope, he and others found that many diseases and toxins produce pathologic effects through thickening of the blood. Knisely developed a grading scale to rate degrees of blood sludging (covered below).
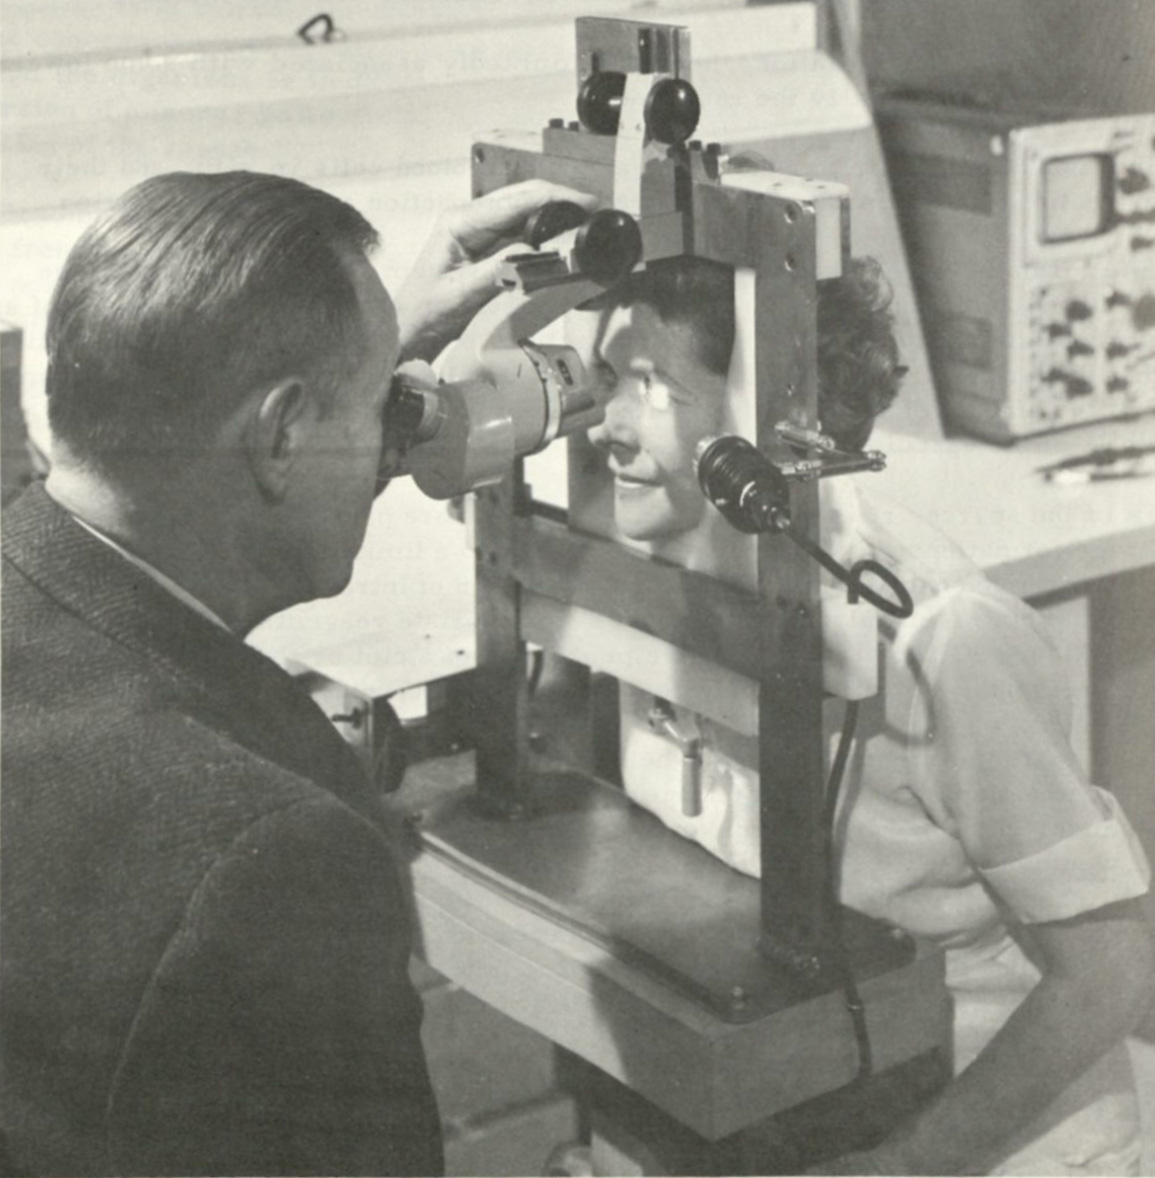
Thomas M. Riddick pictured above using a sclerascope.
Using the sclerascope, Knisely found that hospitalized patients had the most severe cases of sludgy blood. He argued that those diagnosed to be anemic (low red blood cell count) did, in fact, have sludgy blood which holds on to red blood cells so they couldn’t be counted on lab tests. He found that drugs such as hydroxychloroquine, atabrine, and quinine reversed blood sludging. This led him to think that most of the benefit of hydroxychloroquine came from its ability to thin the blood, rather than suppressing the malaria parasite directly.
Instrumental to the sludging process, electrical charge holds red blood cells in suspension. It keeps them from separating and settling out of colloidal suspension, like dirt particles settling out of water. Instead, you want particles, in this case blood cells, to remain evenly distributed throughout their fluid, as homogenized milk does.
However, when RBCs lose their negative charge, gravity causes them to separate from the plasma and collect at low points in the circulatory system. In this state, blood becomes deoxygenated and hypercoagulable. Knisely found that circulation was also disturbed by the degree of sludging according to vessel size, ease of getting around branch points, and elevation. This explains why those with severe sludging can experience serious issues, just by re-positioning their body.
Now a major blunder that fooled medical professionals through the pandemic is that COVID-19 patients can survive blood oxygenation levels that would appear to be fatal. And the reason is, sludgy, stagnant blood clogs up peripheral blood flow where O2 saturation readings are usually taken, which is in a fingertip. To the great misfortune of those hospitalized for COVID-19, deoxygenated blood in a fingertip can easily give an inaccurate reading of systemic oxygen level.
Hence, many patients were put on a ventilator that did not need to be, leading to great (avoidable) loss of life. On the other hand, live blood analysis from a finger prick (designed to get a single drop) can present a pessimistic view of systemic agglomeration levels, because it’s coming from an area of the body more likely to be clumped and clotted than a major artery.
Two lab tests to measure coagulation and clotting
Two lab tests are commonly used to diagnose clotting in small vessels, plus a third test used for another purpose. The first is a “D-dimer” test. D-dimer is a protein that the body uses to dissolve blood clots. The higher the D-dimer level in the blood, the more pervasive (micro)clots are thought to be throughout the body. The D-dimer test has become a preferred method among alternative practitioners to measure the severity of C19-vaccine clotting. However, a variety of exposures and conditions can cause elevated D-dimer levels, so you can’t assume that microclots are being caused by a vaccine.
The second test commonly used to diagnose small vessel clots is erythrocyte sedimentation rate (ESR). ESR measures the speed at which red blood cells (erythrocytes) settle out of plasma (the blood’s liquid). A common cause of excessive ESR is thought to be inflammation – particularly that of an autoimmune nature. The idea being, the immune system releases positively-charged proteins that mess with the blood’s zeta potential, thereby increasing sedimentation.
Knisely found that erythrocyte sedimentation rate (as well as microscopy) tests can underestimate the amount of sludging present, because blood draws tend to come from unaffected, thinner fractions. And protein structures can form in extracted blood that keep RBCs in suspension. Plus, when blood is outside the body it either follows its natural tendency to clot, or anticoagulatory agents such as heparin artificially inhibit clotting. So we don’t actually know what blood’s natural zeta potential really is because it’s rather difficult to measure in its natural environment.
ESR is often elevated in cases of migraine headache. Migraines are another condition that can be caused by blood flow interruptions to the brain. We can deduce that because blood thinners such as aspirin are used to relieve headaches. Same thing with menstrual problems: blood thinners have been used to treat both pain and clotting (the two preceding assessments are my own).
Although Knisely extensively studied blood sludging in a variety of conditions, he was never certain what caused it. He hypothesized that sludging is a result of protein strands and masses grabbing hold of blood cells and not letting go. So while the inherent flaws of blood tests make it tricky to get an accurate picture of the blood’s real sludginess, they do allow conscientious practitioners to glean valuable information.
For their part, A Midwestern Doctor likes to use the sclerascope to detect sludging for the very reason that blood is examined in situ. It need never leave the body. Their team is using this method to study C19 vaccine injuries, as they believe therapies that correct clotting in the eyes can’t help but fix sludging elsewhere in the body.
Bonus testing method: A third test commonly used to measure clotting speed/ability is “prothrombin time” (PT or “pro time”). Prothrombin is a protein made by the liver that helps the liquid portions of the blood to clot. Pro time tests are typically used to monitor clotting time when a patient is on blood thinners such as warfarin. This test is less useful to the sciences of MASS and zeta than the first two, because it measures clotting ability of the plasma, rather than electrical charge on blood cells.
Organized medicine doesn’t like live blood analysis/dark field microscopy
Here’s what Wikipedia has to say about live blood analysis and dark field microscopy: “Live blood analysis (LBA), live cell analysis, Hemaview or nutritional blood analysis is the use of high-resolution dark field microscopy to observe live blood cells. Live blood analysis is promoted by some alternative medicine practitioners, who assert that it can diagnose a range of diseases. There is no scientific evidence that live blood analysis is reliable or effective, and it has been described as a fraudulent means of convincing people that they are ill and should purchase dietary supplements.
Live blood analysis is not accepted in laboratory practice and its validity as a laboratory test has not been established. There is no scientific evidence for the validity of live blood analysis, it has been described as a pseudoscientific, bogus and fraudulent medical test, and its practice has been dismissed by the medical profession as quackery.
The field of live blood microscopy is unregulated, there is no training requirement for practitioners and no recognized qualification, no recognized medical validity to the results, and proponents have made false claims about both medical blood pathology testing and their own services, which some have refused to amend when instructed by the Advertising Standards Authority.”
My opinion: Live blood analysis/dark field microscopy is nothing more than a scientific method to visually analyze blood and pathogens in real time. It’s basically the use of microscopes and special lighting. However, the findings that result from these techniques threaten Big Pharma profits, as well as the field of medicine and the germ theory in general. Mainstream medicine is afraid of what live blood analysis will reveal about their methods of diagnosis and treatment, so they attack it every chance they get. It reveals truth, which they hate.

Image credit: Felipe Reitz. Thermographic image of individual showing deep vein clotting after COVID-19 vaccination, though the individual is often completely asymptomatic and does not feel a thing.
Dr. Ana Mihalcea talks with Felipe Reitz about his findings in this video.
You can’t feel poor circulation… before it causes a chronic condition or acute event
Imagine giving a live television broadcast one minute, and going cross-eyed and collapsing with no warning the next. Imagine feeling perfectly fine running a full marathon, then dropping dead just after you cross the finish line. I have a hard time comprehending such things. But the reality is, this is where presumption of wellness from being asymptomatic can lead to a clumping and clotting emergency. Or, to put it more simply, heart attack, stroke or death is often the first sign that your blood isn’t flowing as well as you thought it was.
The biggest reason you can’t tell how good or bad your circulation is: Blood vessels don’t have blood flow sensors. Instead, larger vessels have pressure sensors. They sense pressure waves which correspond to the beating of the heart. So, if blood pressure appears to be in a normal range, the autonomic nervous system assumes you’re getting enough circulation of RBCs and oxygenation. On the other hand, small vessels can shut down completely when blood pressure drops substantially in order to preserve full blood volume. When white cells block vessels due to MASS, circulation can then flow backwards toward (i.e., from high pressure to low).
Another reason you can’t sense poor circulation is that when RBCs fall out of suspension, the plasma may continue circulating without red blood cells, thereby tricking the body into thinking all’s well when, in fact, tissues and organs are suffocating. The lesson to learn: You can experience sludging and clots in the microvasculature of most areas and not feel a thing. In fact, when you’re inactive, only 10-15% of the smallest capillaries are actively transporting blood at any one time, while maximum exertion requires all of them to be in service.
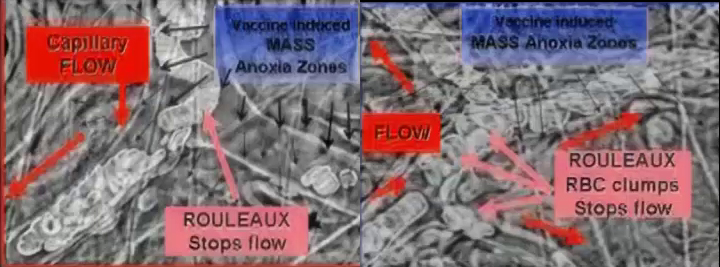
Of course, you can feel clotting and oxygen deprivation after they cause ischemic injuries (inadequate blood supply) to muscles or nerves, such as heart attack or neuropathy. But most microscopic clogs are clinically silent. We just can’t feel many, if not most, blockages in tiny vessels until they give you a wakeup call, so to speak. Some educators have described this scenario as a ‘ticking time bomb’ that can go off suddenly, several quarters after your last shot.
See atypical large clots, and “coffee ground” microclots, in this video excerpt from the documentary “Died Suddenly.”
Some consequences of poor circulation: Clots can cause plasma to leak through vessel walls. If the lymphatic system can’t clear this fluid from tissues, you experience edema (fluid buildup). Another: Hopelessly clogged microvessels close themselves off permanently to prevent hemorrhagic bleeding into surrounding tissue. This causes oxygen deprivation in tissue/organs that are dependent on that supply. Some cells/tissues can scrape by on oxygen absorbed from neighboring tissue via osmosis, but getting rid of toxins is not so easy.
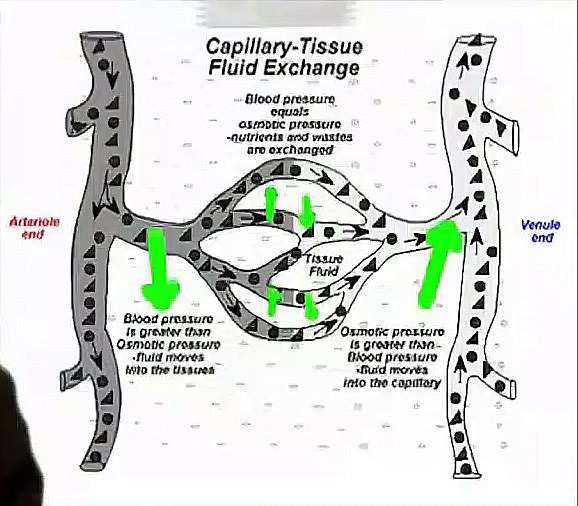
In his science paper, “Heart Disease: A New Approach to Prevention and Control,” Riddick made this point: Although you may not be able to feel intravascular coagulation developing inside you, the disease pathology follows a predictable progression. Specifically, soft-gel sludges, which he thought of as the first stage of cardiovascular disease, consistently precede the occurrence of rigid clots (stage 2) which cause cardiac events. As you may suspect, it’s much easier for the body to break up soft agglomerations with its usual tools such as D-dimer – indeed, it never stops trying – but rigid clots are much more difficult.
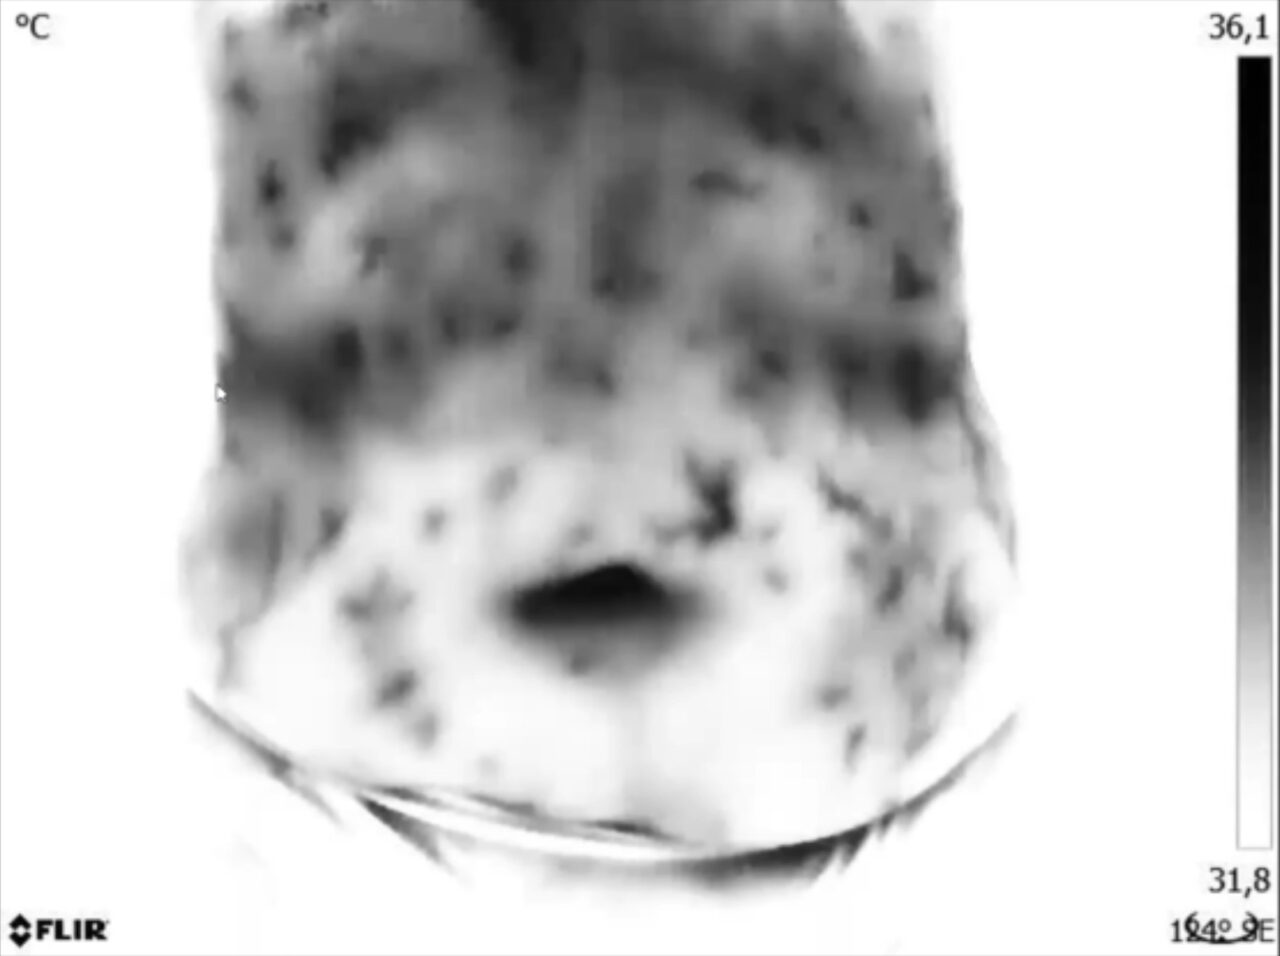
Credit: Felipe Reitz. Thermographic image of individual showing pervasive clotting after COVID-19 vaccination.
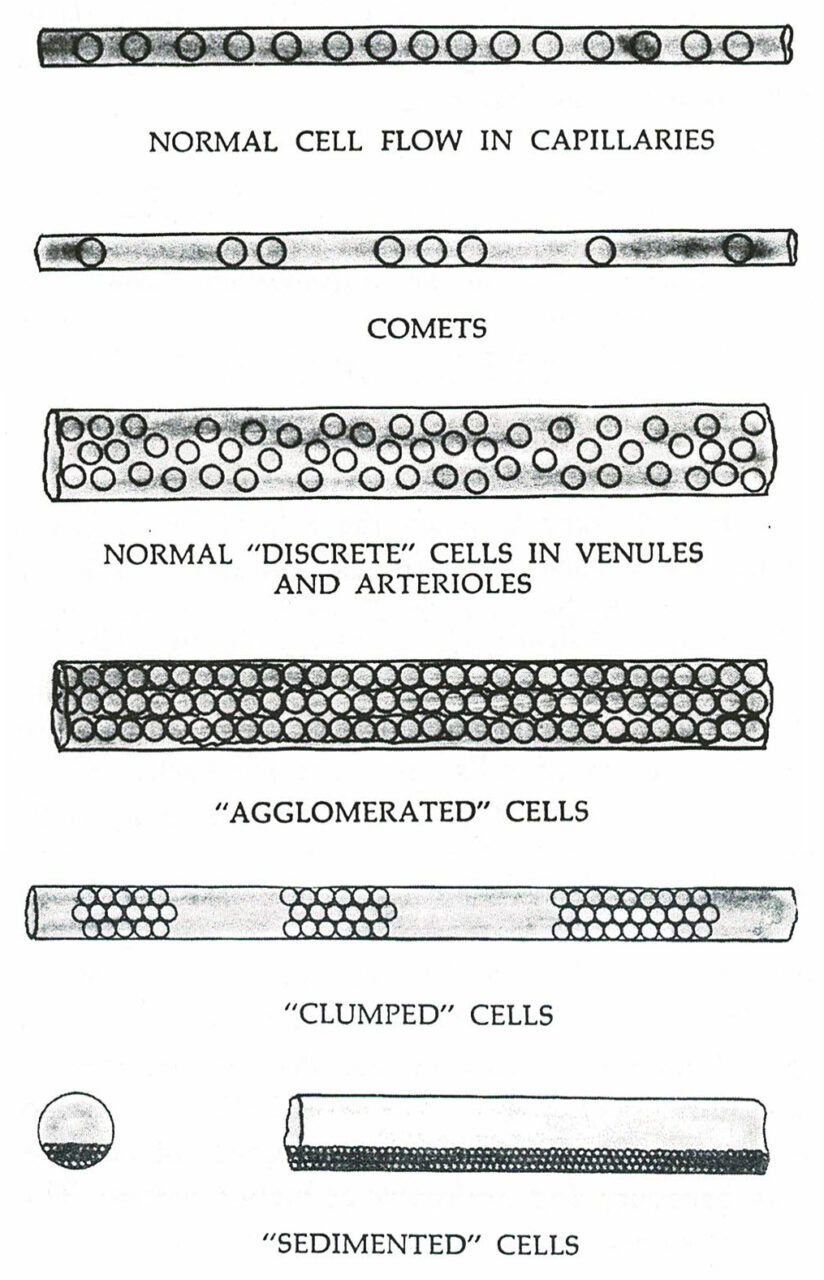
Take aways: Impaired blood flow often goes unrecognized by patients and practitioners. To the surprise of most people, clumping, clotting and slowdowns at both stages typically cannot be felt. It is completely asymptomatic to the individual, though it is easily detected with basic diagnostic tools such as thermal imaging. Alternatively, agglomerations can be seen throughout stage 1 in the sclera or conjunctiva of the eyes with a sclerascope. Riddick graded intravascular coagulation in degrees, from 0-6.
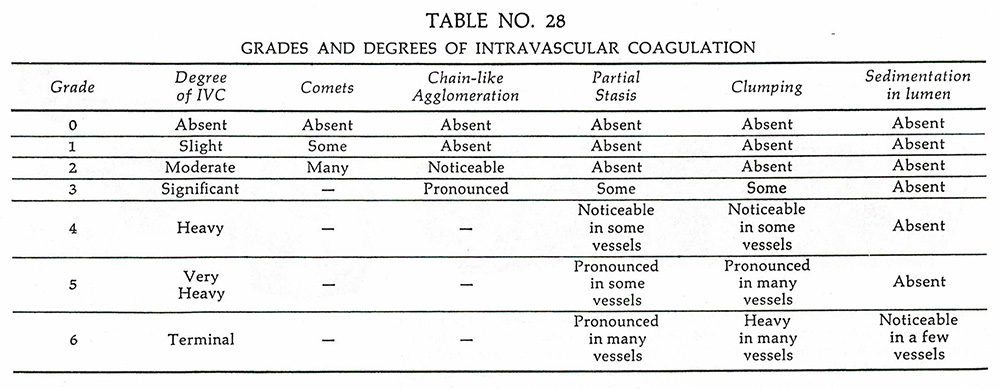
Images above and below from “Control of Colloid Stability through Zeta Potential” by Thomas M. Riddick. All copyrighted images of Riddick used with permission.
“All of us, everybody, every day, many times in the day, if not every time during the day, for every second of the day, your body is constantly having these small, micro-vessel tiny blood clots in many vessel territories in your body. But your body has means by which to deal with these things to keep the blood flow smooth.” — Dr. Andrew Moulden.
How spike proteins cause sludging and clotting problems
The SARS-CoV-2 spike protein is very good at making each of the three clot types happen (described above). This is likely due to: (1) the spike protein’s ability to weaken zeta potential of blood cells, (2) the inner vessel walls (endothelium) having lots of ACE2 receptors that spike proteins bind to, and (3) the positively-charged spike proteins being attracted to the negative charge of the fuzzy surface of inner vessel walls (glycocalyx).
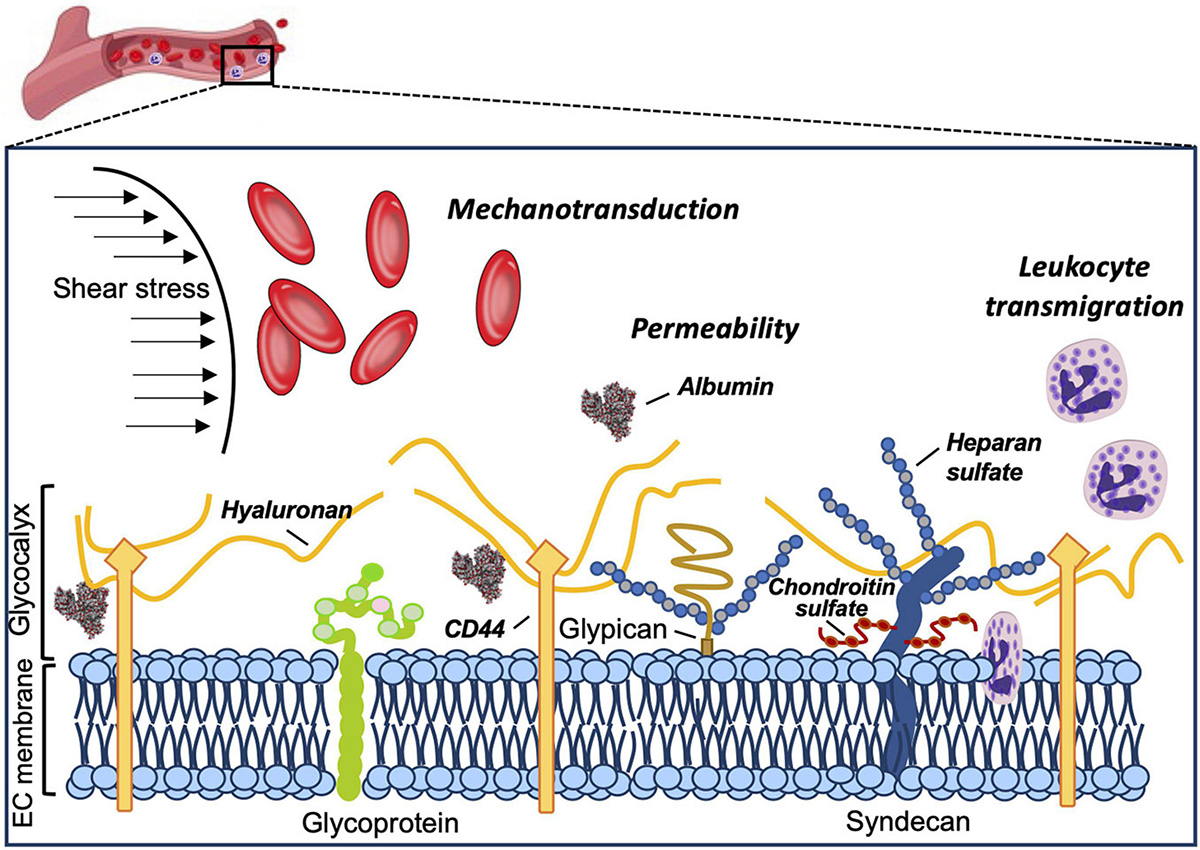
Graphic from the paper “The Endothelial Glycocalyx as a Double-Edged Sword in Microvascular Homeostasis and Pathogenesis” by authors Villalba et al., with funding from NIH. Front. Cell Dev. Biol. 9:711003. doi: 10.3389/fcell.2021.711003. Copyright © 2021 Villalba, Baby and Yuan.
Looking somewhat like microscopic fur, the glycocalyx forms a gel layer that protects the vessel walls from shear stress (link to paper) by electrostatic repulsion and by stimulating nitric oxide production (a vasodilator) when the vessel needs to expand. However, when spike proteins disturb zeta potential and glycocalyx function, resistance to blood flow rises from lack of vasodilation, friction from loss of charge, and the inherent stickiness of (glyco)proteins. Just imagine if the bristly texture of the glycocalyx pictured above were not coated with gel. The walls would be like sandpaper to cell traffic.
Image below from the paper “Additional Positive Electric Residues in the Crucial Spike Glycoprotein S Regions of the New SARS-CoV-2 Variants” by Pawłowski PH. Infect Drug Resist. 2021 Dec 1;14:5099-5105. doi: 10.2147/IDR.S342068. PMID: 34880635; PMCID: PMC8647725. Link here.
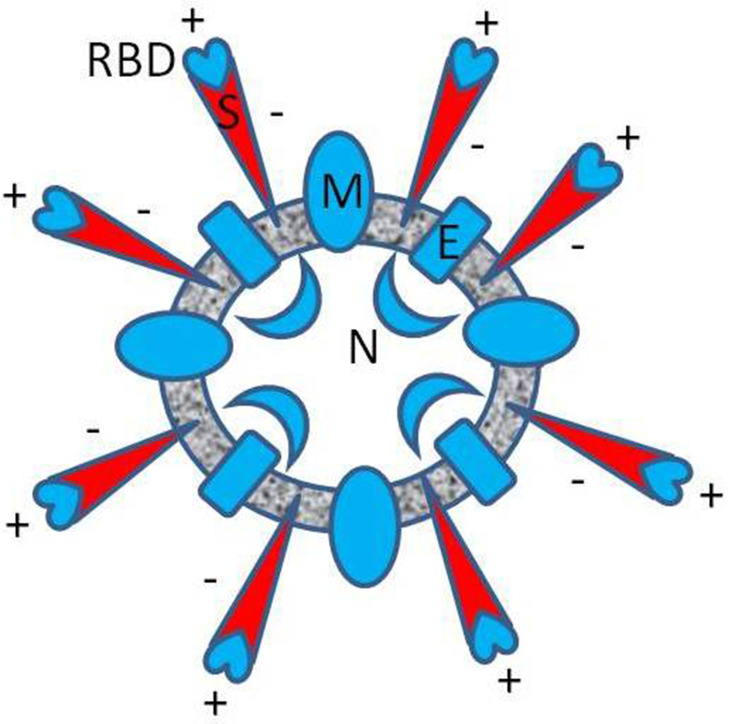
Approximate diagram of the spatial distribution of electric charge in SARS-CoV-2 (B.1 variant). The entire charge of spike protein (S) is negative (red), −12 [e], but locally, in the receptor binding domain (RBD), the resultant charge is positive, +7 [e], as was reported in Pawłowski’s study.
The SARS-CoV-2 virus carries even greater charge than SARS-CoV-1. Specifically, the ends of the spikes carry a positive charge. That means any spike proteins, whether from a natural infection or a vaccine, collapses zeta potential on the red blood cells. Spike proteins also have the dubious distinction of possessing similar proteins to that of the human body – particularly the inner vessel walls (endothelium).
That means when they stick to the endothelium and clog the blood vessels, the immune system mistakes spike proteins for human cells, thereby inducing an autoimmune attack. Even worse for infectivity, positive charge of new SARS-CoV-2 variants is increasing. This makes it easier for spike proteins to cling to human tissue, infect cells, and cause disease. However, new variants tend to be less deadly.
Blood sugar depletes zeta potential
High blood-sugar in diabetics breaks down the glycocalyx in structure and charge (e-zone, detailed below), in addition to depleting zeta of RBCs. This explains the strong correlation between diabetes and poor circulation with accompanying nerve damage (neuropathy). That is, sugar in the bloodstream lowers electrical charge on RBCs and the glycocalyx. Having lost its function, the glycocalyx then can’t produce nitric oxide to dilate blood vessels. These factors combine to cause circulation problems, leading to nerve death. We call this neuropathy.
Evidence we’re on the right track
In his epic treatise, The Fourth Phase of Water (highly recommended), Prof. Gerald Pollack theorizes that the interior of blood vessels may be coated with gel-state water to promote blood flow. Based on what the glycocalyx looks like and how it works, Prof. Pollack appears be correct: The fuzzy surface of the glycocalyx holds gel-state water in its stringy fibers, thereby facilitating blood flow and protecting the walls from shear stress. Then, should the glycocalyx break down from too much positive charge around it, (positive) pathogens or toxins can attack endothelial cells along the vessel walls (labeled “EC membrane” in the above graphic). Inflammation is sure to ensue.
This is likely to be a primary path through which a buildup of fats, cholesterol and other substances begins to form in arteries in the effort to repair damaged vessels (atherosclerosis). From the other direction, I believe lead and mercury buildup in endothelial cells upsets glycocalyx function with their positive charge, which then degrades the glycocalyx from the inside out with platelet, cholesterol and fibrocyte-repair processes. (See The Mitochondriac Manifesto for more details.)
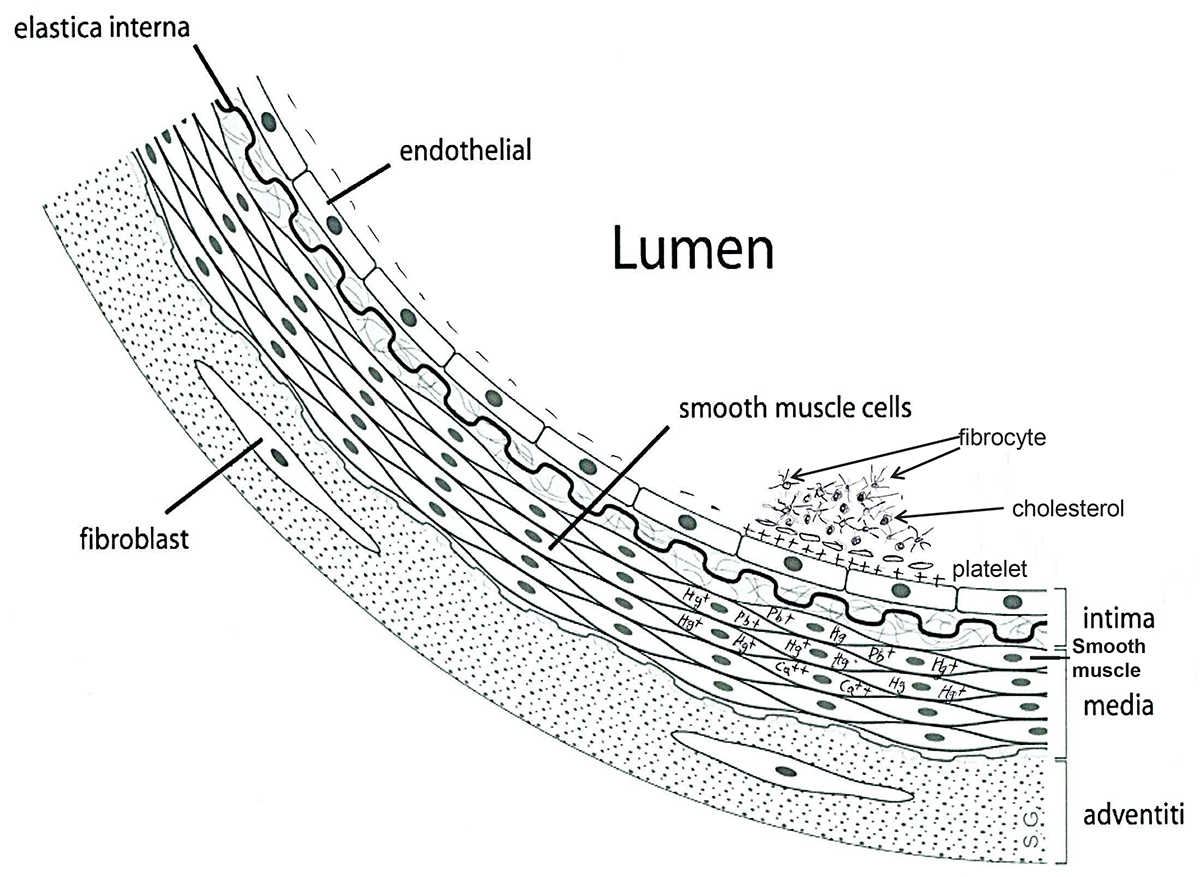
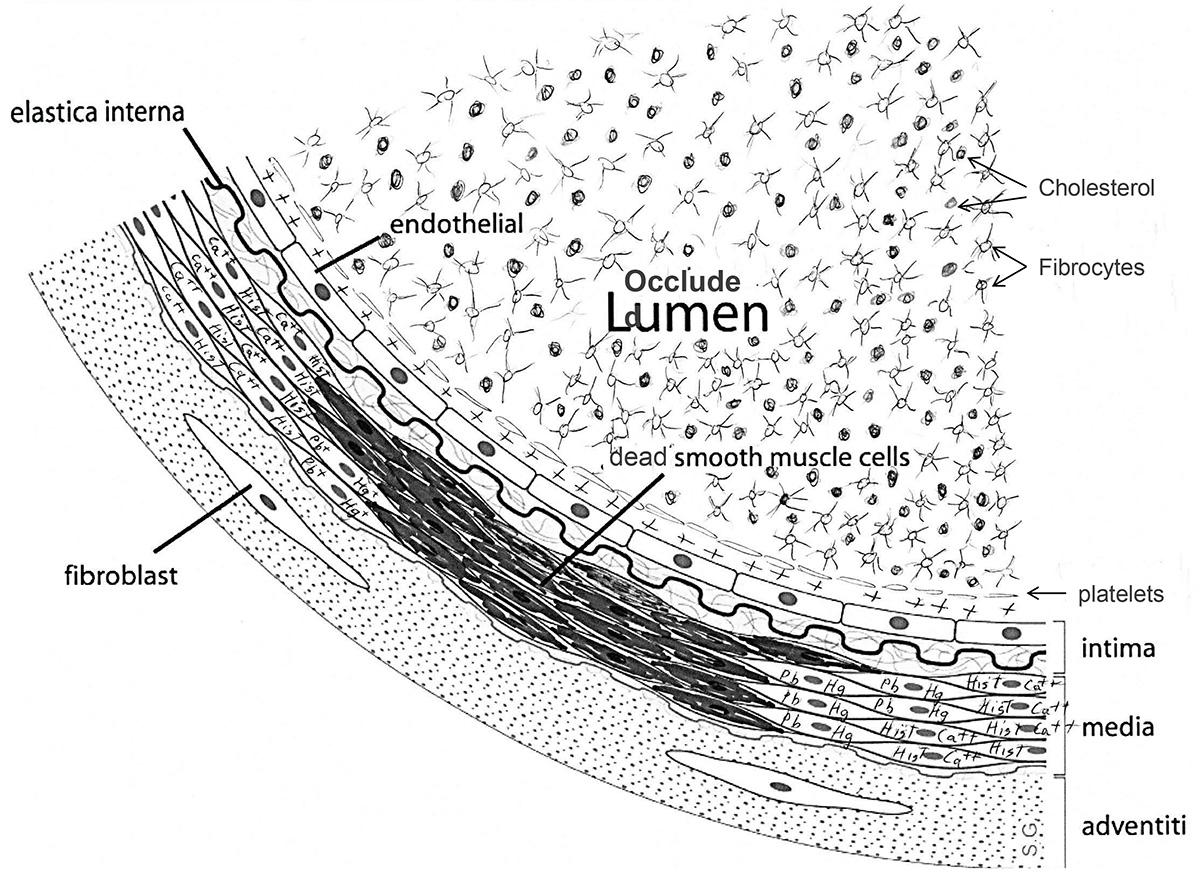
Concepts in the above graphics are the work of Dr. Dean Bonlie (images are modified from Creative Commons works).
Both processes initiate vascular disease as a means to heal injury. However, the way these defects present themselves is so seemingly unrelated to how they started, most medical professionals are confused as to what is actually helping you and what’s hurting. Namely, practitioners villainize the cholesterol they find at the site, even though the body is using it to repair damaged vessels. Simply said, cholesterol does not cause heart disease. You’ve been lied to. And if you knew how many ways the body uses cholesterol to run its essential processes, you’d agree too. But that’s a story for another day.
See Gut-Brain Secrets to learn more about how the body uses cholesterol (article about cholesterol).
Let’s clear up a misconception about electrocardiograms
Mainstream medicine thinks what we see on an electrocardiogram (ECG or EKG) is the electrical impulses emitted by the heart, depicted in graph form. They say the heart produces electrical activity in the course of doing its job of pumping blood around the body. By examining the electrical waveform produced by the heart, practitioners can then diagnose and hopefully treat (or even avert) heart issues, because they know how well/poorly the heart is performing. That’s their understanding.
However, that may not be entirely accurate. There’s a growing contingent, including Riddick in his day and myself today, that propose a different explanation of what’s actually happening. It boils down to this: The classic view is that electrical activity (polarization and depolarization, or charging up and discharging) contracts the heart muscle to pump blood around the body, which we visualize as an ECG.
But this might be closer to the truth: Movement of the blood’s charged particles induces electrical impulses which we read as “heart rhythms” on an ECG. In science terms, this could be described as “electroendosmosis” (movement induced by electric field) in reverse, or “electrokinetic vascular streaming potential” (EVSP). To put it more simply, the nervous system does not produce electrical impulses which contract the heart and create pressure waves. Instead, the flow of charged particles through blood vessels is what produces electrical signals on an ECG. The results are exactly the same. But which one is cause and which one is effect?
Whatever the case may be, one thing is for sure: The heart does not pump blood around the body the way that we’re taught. That’s ludicrous. An organ weighing 7-15 ounces pumping blood through the friction of some 60,000 miles of microscopic tubing which is smaller than red blood cells… yeah, right. The heart could not produce the hydraulic pressure needed, and the vessels couldn’t take it. Read the ideological seeds of these monographs in The Mitochondriac Manifesto for a detailed description of how the heart and the blood really function.
Negative charge is the polarity of health and healing. Positive charge is the polarity of injury and imbalance
Zooming back out, we learn that negative charge (i.e., surplus of electrons) represents good health and healing because electrons move materials (e.g., blood, hormones and the pumps that make ATP) and repair free radical damage (i.e., antioxidant effect). A state of balance is virtually synonymous with electron abundance.
On the other hand, surpluses of (positive) protons represent acidity, inflammation, free radical damage, and oxidative stress. That’s because most pathogens, toxins and injury itself carry a positive charge. Positive charge is the distress signal that activates repair mechanisms. Damaged tissue uses this principle to broadcast a state of disorder.
For example, if you pinch or cut yourself, positively-charged histamine rises in an area to initiate healing. Repair cells such as (-) white blood cells and platelets then stick to (+) damaged tissue, form clots, stop the bleeding, and begin the healing process. Same thing with bacterial or viral infections: it’s their positive charge that helps tell the immune system there’s a problem brewing in the area.